8 Foreground of the CMB
Foregrounds, Planck, CMB polarization, Power spectra
8 Foreground of the CMB
Now that we know what knowledge we might gain from the CMB, we turn our attention to how we might observe and analyze it.
8.1 Intensity
We already peeked ahead at fig. 5.1, this time we want to focus on some peculiar grey lines on the maps. These represent masking regions within which we actually did not observe the CMB.
The reason is simply that when we look for the Cosmic Microwave Background, there are foreground contaminations from many sources. For example, there is a big horizontal region, corresponding to our own galaxy.
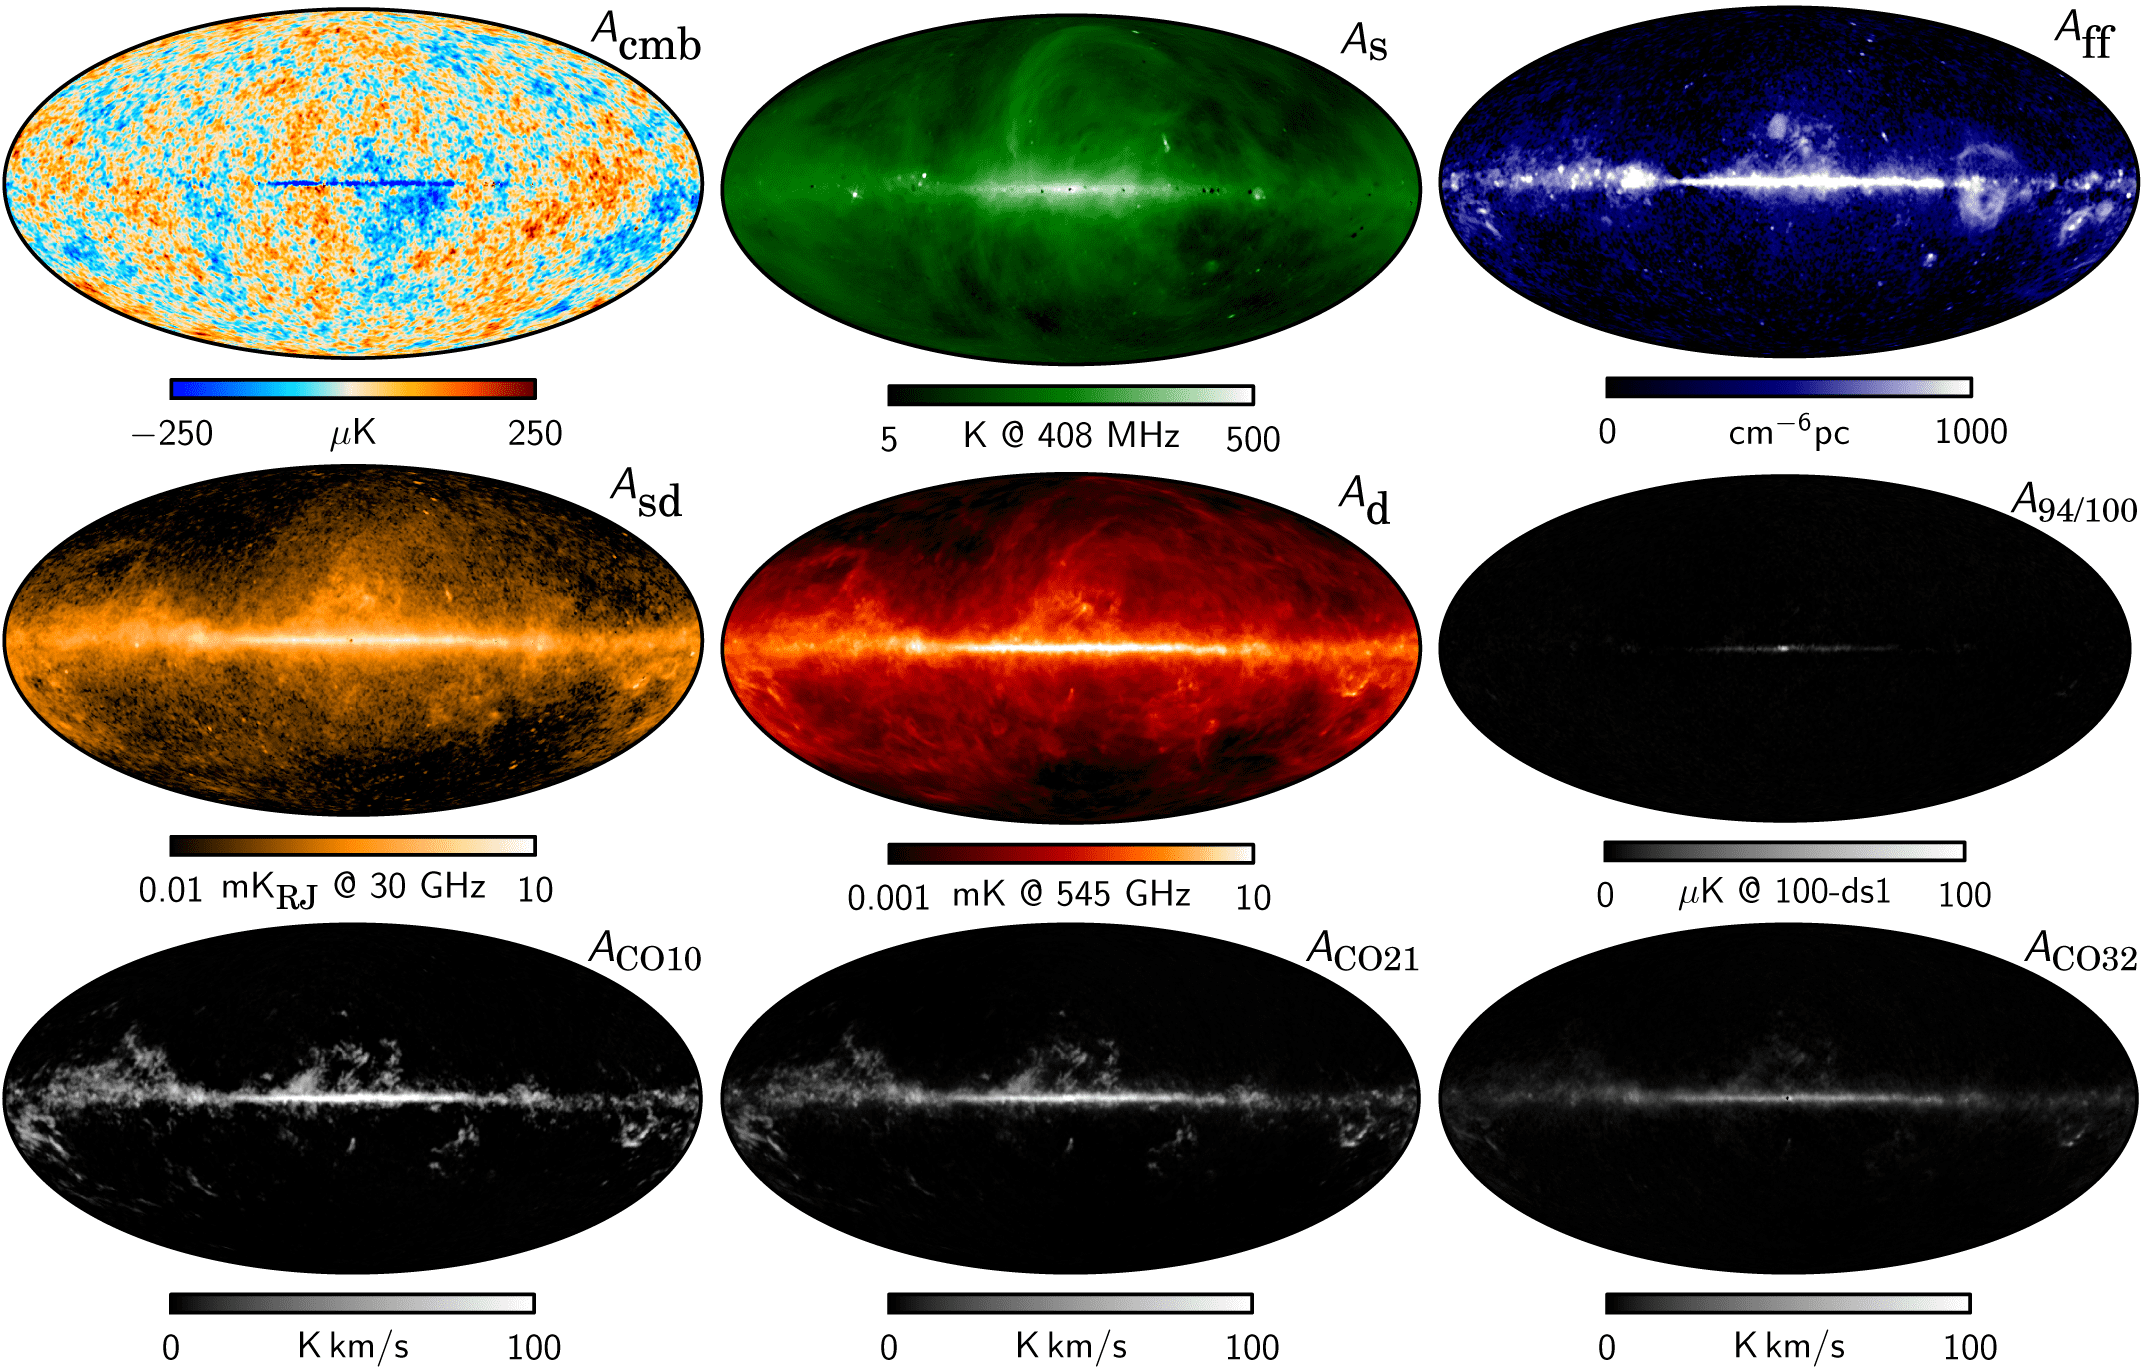
Here in fig. 8.1 we can see maps of different components. We are not going into the details here, but it suffices to say that around \({20\,\%}\) of the sky is too bright corresponding to the masked out region in fig. 5.1. And also different components may be stronger at different frequencies.
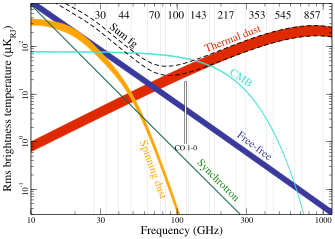
It is more obvious in power-spectra domain, here in fig. 8.2 we can see the foreground components have different frequency dependence from the CMB, and importantly for the Intensity, at some frequencies the CMB is brighter than all foregrounds combined.
8.2 Polarization
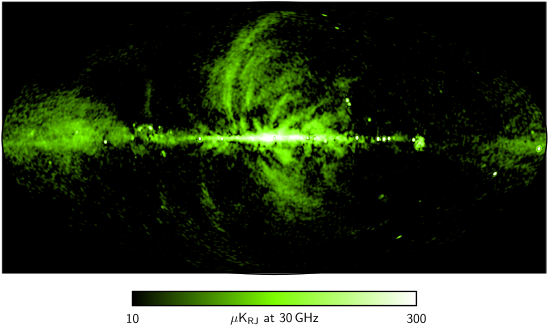
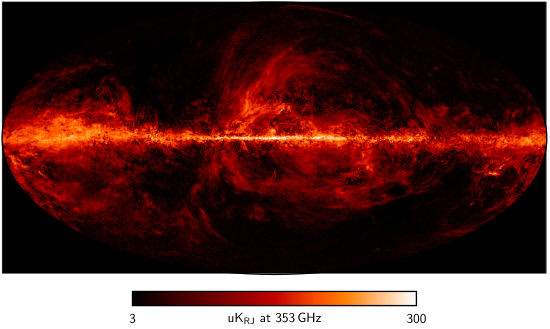
Here in fig. 8.3 & fig. 8.4, we see the situation is quite different for polarizations. First, there are only 2 sources of significant foreground polarization—synchrotron and dust.
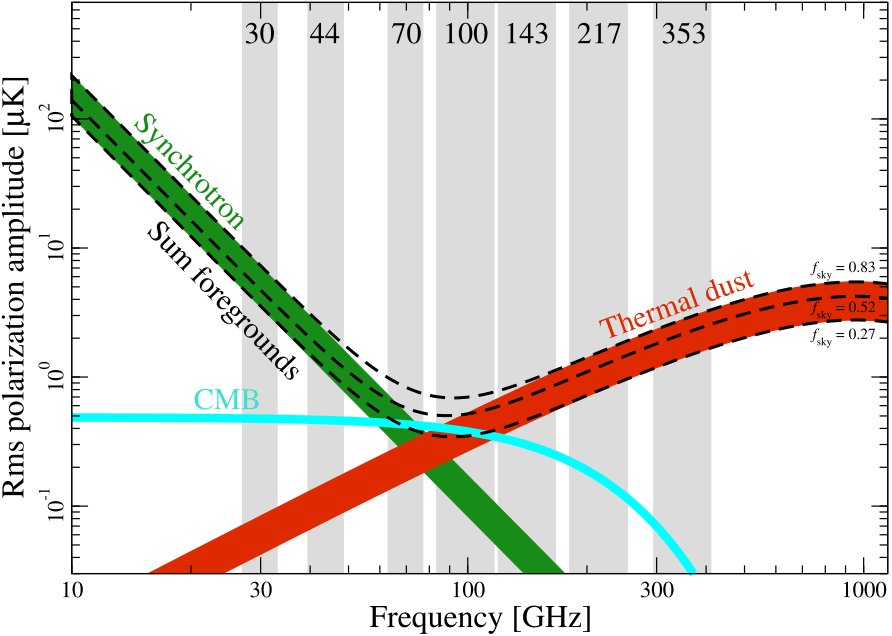
Second, as it becomes obvious in power-spectra domain in fig. 8.5, nowhere does the CMB dominate over foreground contaminants. Therefore, in measuring the polarization of the CMB, it is particularly important to measure in multiple frequencies.
Footnotes
Planck Collaboration, Adam, et al., “Planck 2015 Results”.↩︎
Planck Collaboration, Adam, et al., “Planck 2015 Results”.↩︎
Planck Collaboration, Akrami, Ashdown, et al., “Planck 2018 Results”.↩︎
Planck Collaboration, Akrami, Ashdown, et al., “Planck 2018 Results”.↩︎
Planck Collaboration, Akrami, Ashdown, et al., “Planck 2018 Results”.↩︎